Noticed that if I run nodemon within intellij, I would not be able to debug any more inside intellij.
Not sure what reason it is. If just run the nodejs, no problem. However once I add the ‘/usr/local/bin/nodemon’ into the Node parameters of the run config, the breakpoint would not work.
solution
To solve this problem, i have to use the Node.js remote debug.
Steps are
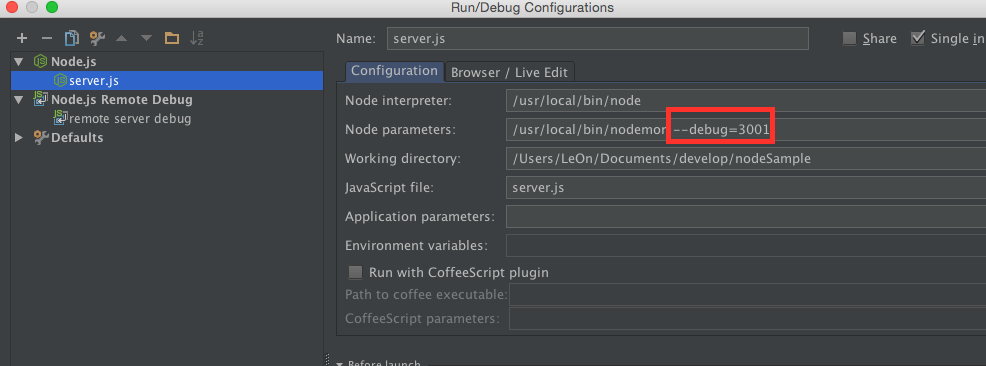
1. add a debug port to the Node parameters
–debug=3001. Note It is double dash. this should be the same as the port in the following remote debug config.
in the intellij doc, another option is to use –debug-brk which would enable the debug to run from the start. I tried this param, it works if I just change some front end html/js, however it would not work when backend js changed. Might have other workaround if you have to debug some init processes.
2. add a new Node.js remote debug config in Intellij

Now you should be able to use run RUN to start the server.js application and use DEBUG to start the ‘remote server debug’ and then set break point in your node app. 🙂

Thank you! It’s awesome and it works.
hi, i followed the steps above and when i launch the debugger, in the console pane it shows “connected to localhost:3001”, however the application doesnt stop at break points. im on intellij idea 14. would appreciate any help.
hmmm, i do not see anything special in these setup steps. I do not have much clue on what’s going on in ur machine.
U sure u r using the remote debug rather than just start the server in debug mode?
yes, i m running the server on port 9000 and specifying port 3001 for debug. Then I’m starting the remote debugger from intellij and it shows connected to 3001. Post this, the code doesnt break at the specified breakpoints. However If i press the pause button (Suspend program execution and enable debugging)… the program pauses, but no idea where and then if i click the step to next line it completes the execution and doesnt break anywhere.
It works fine, but when you change something on your server, the nodemon is restarting, which restarts the node –debug process too. As a result, your Remote Node Debug will be disconnected, and you need to restart it all the time when you do some changes to keep your breakpoint alive.
It’s not work in phpstorm 2016.3 and nodejs version 8.7